What’s an Empathy Map and How to Create One?

Empathy maps are famously used by UX designers since they help create products that keep the focal point on the user, resulting in an overall better experience with the features. These maps are now also being used by other types of businesses in their marketing strategies to avoid the risk of spending tons of money on something customers might not even like or find appealing. They can be created by practically anyone. All you need to do is follow a few key guidelines. So, here’s how to make an empathy map for your SaaS company.
What Is an Empathy Map?
Most people assume they know exactly what their customer wants and what will appeal to them but a lot of times, they end up being wrong. By then, they may have already spent a ton of money or time on a marketing strategy or product.
That’s exactly why empathy maps were created—so you no longer have to guess anymore but have clear, hard facts.
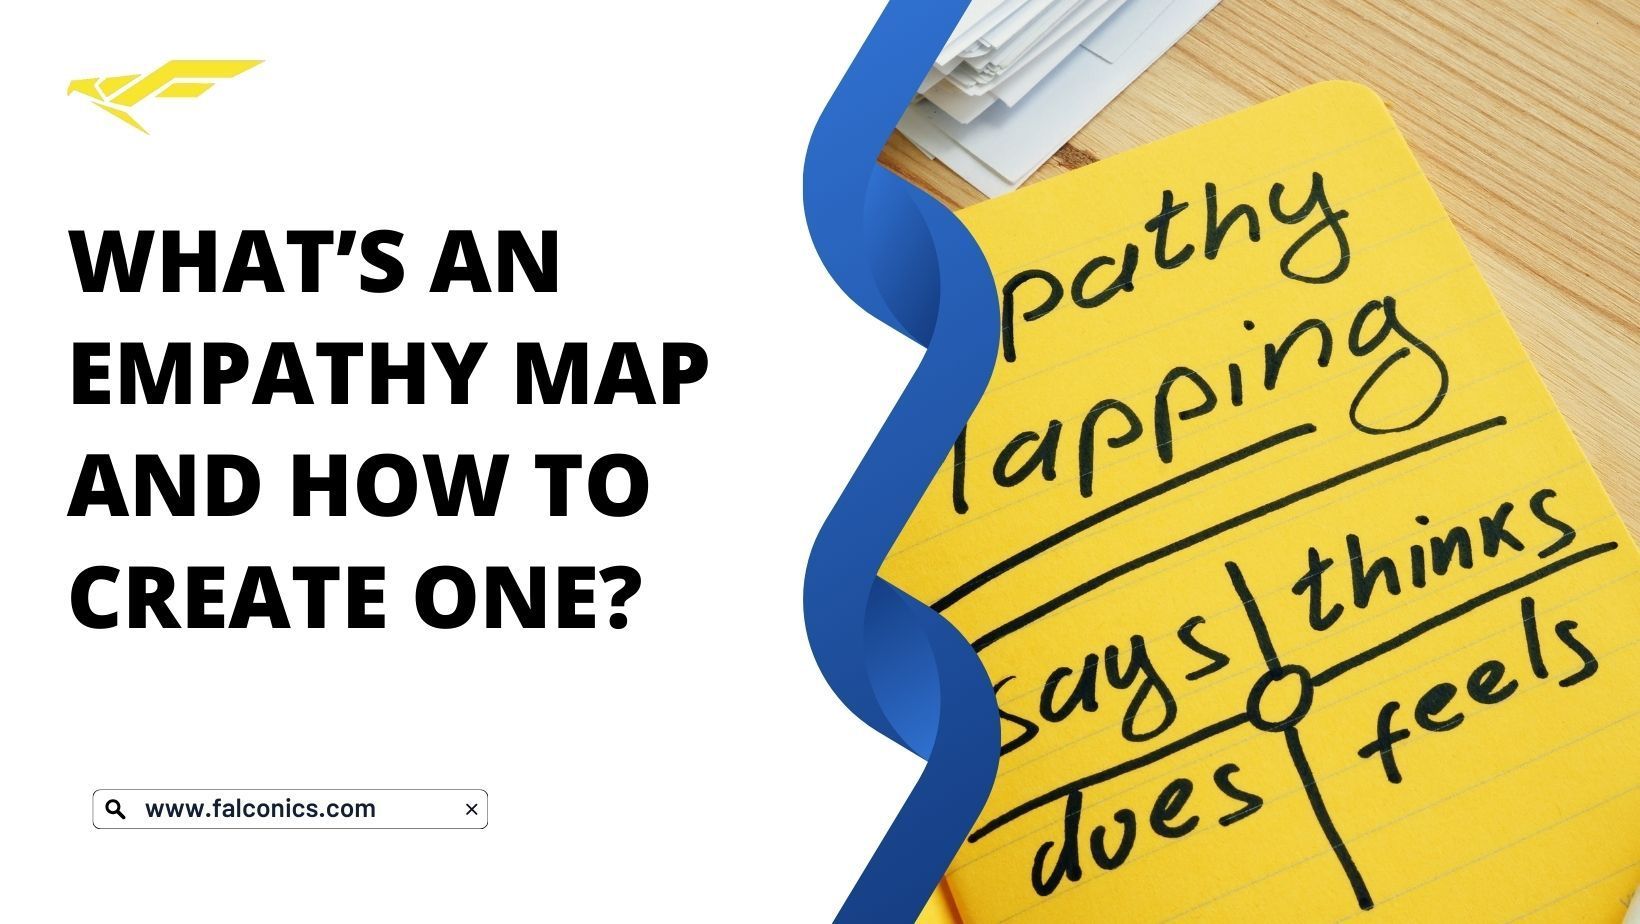
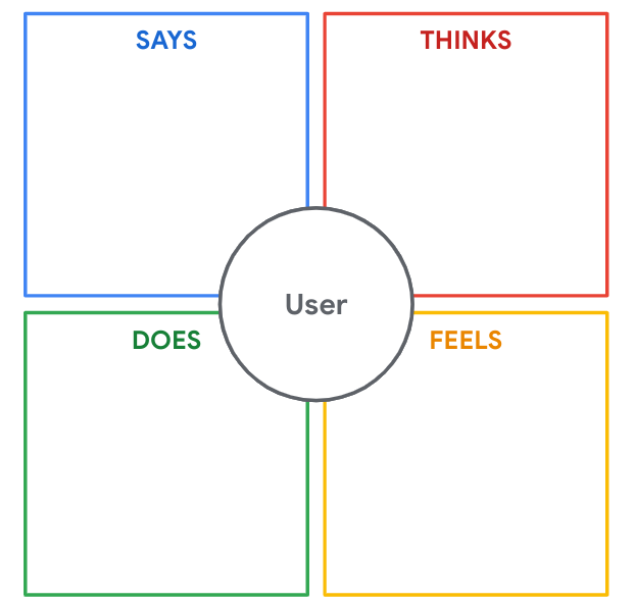
Empathy maps consist of four quadrants which reflect what the user demonstrated during the research or observation stage. It refers to what the user: Said, Did, Thought, and Felt. These traits typically play a pivotal role in determining a customer's purchase decisions. It’s fairly easy to determine what a customer Said and Did. Thought and Felt require a little more digging.
Why Use an Empathy Map?
- Since you’ll know exactly what your customer wants, you can design products or services that meet their needs.
- You’ll be able to create messaging that speaks directly to your customer base. This will make your campaigns more effective.
- You’ll no longer be wasting resources on ideas that don’t work.
How to Create an Empathy Map
Here’s a step-by-step guide to help you create an empathy map:
Step 1: Gather Your Materials

It’s always good to have your empathy map visually laid out in a large space. So the first thing you want to do is get some large paper or a whiteboard and split it into four sections labeled: Says, Thinks, Does, and Feels. This will be your template.
Keep some sticky notes or markers handy for jotting down ideas as you go. If you’re working remotely or prefer digital tools, use Miro, Lucidchart, or Google Slides for mapping. Everyone can join in with these tools and you can easily update them.
Step 2: Set Your Goals
Since you’re dealing with a SaaS company, your goals might be a little different from those of a traditional product-based business. So, think about what you want to achieve with this empathy map. This will also help you frame the questions for the questionnaire or survey. Here are a few prompts to help you:
Who is your ideal user? Define who you’re mapping for. Are you targeting a new customer segment, or are you looking to understand existing users better?
What are you hoping to learn? Maybe you’re trying to understand why users drop off at a certain point in the onboarding process. Or maybe you’re curious about what features matter most to them.
What decisions will this map influence? Are you planning a new feature? Improving your messaging? Updating your product?
Step 3: Collect Data
Now comes the real digging. To make your empathy map accurate, you’ll need real insights from actual users.
You’ll need to use three methods to collect data.
First, you’ll need to conduct one-on-one interviews where you’ll ask open-ended questions to get users talking about their experiences with your product. Heads up, though—this can take a lot of time.
Second, you’ll need to send out surveys or questionnaires. Keep the questions specific to uncover what users like, what frustrates them, and what they wish was different. Make sure to include both multiple-choice and open-ended questions.
Third, use observation methods like Google Analytics to see how users interact with your product. If your product is trending on social media or different forums, monitor what the users are saying.
Step 4: Fill in the Quadrants
Now time to enter the data you just acquired. Here’s how to fill in each quadrant:
Says: What did your customer actually say? Include direct quotes or statements. They could be positive (“I love how simple this product is”) or negative (“I can’t figure out how to use this feature”).
Thinks: What’s on their mind? These could be assumptions or thoughts that may impact how they interact with your product. For instance, a user might be thinking, “Is this really worth the price?” or “This feature could save me time, but I’m not sure how it works.” You may need to make a few guesses here, based on patterns you noticed in the data.
Does: What actions do they take when interacting with your product? Are they using specific features repeatedly? Skipping certain steps? Watching tutorial videos?
Feels: How are they feeling as they use your product? Are they feeling frustrated, excited, confused, or satisfied?
Step 5: Look for Patterns and Insights
Now that you’ve filled out all four quadrants, step back and take a closer look at it. Do you see any patterns? Are there certain pain points, needs, or frustrations users mention repeatedly? Do these feelings mean that they drop off or abandon that particular feature? What improvements would they like to see from that feature?
Or,
If they’re excited about a feature, are they engaging with it more? If not, what would increase engagement?
Use all this data to focus your marketing and product-building efforts. When you’re working with direct insights from real customers, it’s one of the best ways to make sure you’re meeting their needs.
Summary
Empathy maps are a great tool to truly understand what your customers say, think, do, and feel, so you can create products, services, and messaging that truly resonate. Follow the steps in this guide to create your own map!
Want to take your marketing to the next level? At Falconics, we’re leaders in ERM, specifically designed for B2B SaaS companies. As industry experts, we develop strategies that help you create deeper connections with your customers. Ready to see how? Contact us today.
Ready To Take It To The Next Level?
Sign up to our newsletter
Congratulations on taking the first step to upgrading your social!
Our team will be reaching out to you in the next few hours.
Have the best day!
Please try again later
Contact us
Phone: (407) 798-7611
Address:
Email: contactus@falconics.com
Menu
All Rights Reserved | Falconics Agency ™️ | Terms & Conditions | Privacy Policy


